 |
 |
![]()
Perhaps the most fundamental set of properties of lakes relates to the interactions of light, temperature and wind mixing. The absorption and attenuation of light by the water column are major factors controlling temperature and potential photosynthesis. Photosynthesis provides the food that supports much of the food web. It also provides much of the dissolved oxygen in the water. Solar radiation is the major source of heat to the water column and is a major factor determining wind patterns in the lake basin and water movements.
Light intensity at the lake surface varies seasonally and with cloud cover and decreases with depth down the water column. The deeper into the water column that light can penetrate, the deeper photosynthesis can occur. Photosynthetic organisms include algae suspended in the water (phytoplankton), algae attached to surfaces (periphyton), and vascular aquatic plants (macrophytes).
The rate at which light decreases with depth depends upon the amount of light-absorbing dissolved substances (mostly organic carbon compounds washed in from decomposing vegetation in the watershed) and the amount of absorption and scattering caused by suspended materials (soil particles from the watershed, algae and detritus).
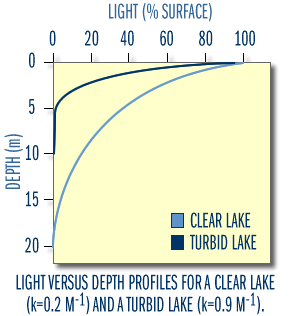
The percentage of the surface light absorbed or scattered in a 1 meter long vertical column of water, is called the vertical extinction coefficient. This parameter is symbolized by "k".
In lakes with low k-values, light penetrates deeper than in those with high k-values. Figure 2 shows the light attenuation profiles from two lakes with attenuation coefficients of 0.2/m and 0.9/m.

Figure 2
The maximum depth at which algae and macrophytes can grow is determined by light levels. Limnologists estimate this depth to be the point at which the amount of light available is reduced to 0.5%–1% of the amount of light available at the lake surface. This is called the euphotic zone. A general rule of thumb is that this depth is about 2 to 3 times the limit of visibility as estimated using a Secchi disk. Light may be measured in a variety of ways for a number of different characteristics. The reader is referred to the reference texts for more information. Since photosynthesis depends fundamentally on light, significant changes in light penetration in a lake will produce a variety of direct and indirect biological and chemical effects. Significant changes in lake transparency are most often the result of human activities, usually in association with landuse activities in the watershed.
Also see "What is Light?" for an excellent primer on light.
|
Table
1. Estimated ranges of water transparency values for various lakes.
"Clear" water refers to the lack of bog-staining color. WOW lakes in bold face. Vertical extinction coefficient, k, defined previously. Secchi depths in meters. |
||||
|
|
k |
Secchi |
Euphotic Zone (m) |
|
|
Crater Lake (OR) |
0.06—0.12 |
25—45 |
>120 |
Clear, sky blue ultra-oligotrophic lake |
|
Lake Tahoe (CA/NV) |
0.12 |
40 |
90—136 |
As above
but decreasing clarity since1960s due to watershed overdevelopment |
|
Lake Superior |
||||
|
Lake
Superior |
0.13 |
15—20 |
46—60 |
Ultra-oligotrophic; most oligotrophic of the Laurentian Great Lakes |
|
Lake
Superior |
0.3 |
5—12 |
20—30 |
Western arm near Duluth and St. Louis River and harbor inputs |
|
St.
Louis River (Duluth-Superior |
4.21 |
0.7 |
>5 |
Brown (bog) stained from river plus high suspended sediments |
|
Lake Michigan |
0.19—0.24 |
? |
19—31 |
Meso-oligotrophic |
|
Lake Huron |
0.1 — 0.5 |
? |
25—31 |
Meso-oligotrophic |
|
Lake Erie |
0.2 — 1.2 |
2—10 (1970—1990) >10 (1993—1995) |
12—26 |
Eutrophic (clarity improving recently due to zebra mussels) |
|
Lake Ontario |
0.15 — 1.2 |
? |
12—29 |
Mesotrophic |
|
Lake Baikal, Siberia |
0.2 |
5—40 |
15—75 |
Oligotrophic |
|
Grindstone
Lake |
0.82
|
3—6 |
8—20 |
Mesotrophic, water is fairly stained or colored |
|
Ice
Lake |
0.83 |
2—5 |
6—15 |
Mesotrophic |
|
Lake Minnetonka (Hennepin County, MN) |
||||
|
West Upper |
0.78 |
1.4 |
3—5 |
Mesotrophic |
|
Halsted Bay |
2.9 |
0.5 |
<2 |
Eutrophic |