 |
 |
![]()

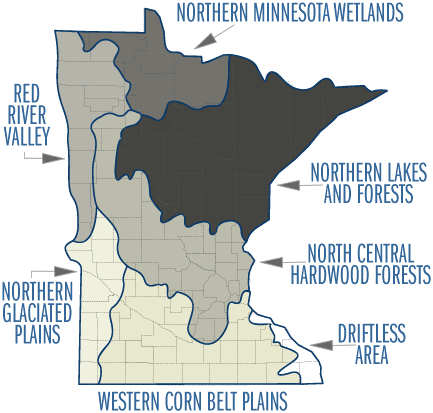
Figure 23
Observations of lake characteristics that are geographically-distinct have led to the ecoregion approach of lake classification developed by the U.S. Environmental Protection Agency (EPA) Research Laboratory at Corvallis, Oregon. Ecoregions are areas of relative homogeneity based on landuse, soils, land and surface form, and potential natural vegetation. Minnesota is divided into seven ecoregions (Figure 23), but most of its lakes are found in four of these. Minnesota Pollution Control Agency (MPCA) researchers found regional patterns in numbers of lakes, lake water quality, morphometry, and watershed characteristics (Table 5) among these ecoregions. For example, lakes of the Northern Lakes and Forests ecoregion have significantly lower total phosphorus and chlorophyll than lakes in the Western Corn Belt Plains ecoregion. Furthermore, the MPCA discovered through lake-user surveys that user perception of water quality varied by ecoregions. This has led to ecoregion-specific criteria for phosphorus and, in general, helped to clarify expectations and goals for protecting lakes in Minnesota.
|
Table
5 |
||||
|
PARAMETER |
Northern |
North Central Hardwood Forests |
Western Corn Belt Plains |
Northern |
|
Total Phosphorus (µg/L) |
14 - 17 |
23 - 50 |
65 - 150 |
130 - 250 |
|
Chlorophyll-mean (µg/L) |
< 10 |
5 -22 |
30 - 80 |
30 - 55 |
|
Chlorophyll-max (µg/L) |
< 15 |
7 - 37 |
60 - 140 |
40 - 93 |
| Secchi Disk (m) |
2.4 - 4.6 |
1.5 - 3.2 |
0.5 - 1.0 |
0.3 - 1.0 |
|
Total Kjeldahl - N (mg/L) |
< 0.75 |
< 0.60 - 1.2 |
1.3 - 2.7 |
1.8 - 2.3 |
|
[Nitrite + Nitrate]-N (mg/L) |
< 0.01 |
< 0.01 |
0.01 - 0.02 |
0.01 - 0.1 |
|
Alkalinity (mg/L) |
40 - 140 |
75 - 150 |
125 - 165 |
160 - 260 |
|
Color (Pt-Co units) |
10 - 35 |
10 - 20 |
15 - 25 |
20 - 30 |
|
pH |
7.2 - 8.3 |
8.6 - 8.8 |
8.2 - 9.0 |
8.3 - 8.6 |
|
Chloride (mg/L) |
< 2 |
4 - 10 |
13 - 22 |
11 - 18 |
|
TSS (µg/L) |
< 1 - 2 |
2 - 6 |
7 - 18 |
10 - 30 |
|
Turbidity (NTU) |
< 2 |
1 - 2 |
3 - 8 |
6 - 17 |
|
EC (uS/cm) |
50 - 250 |
300 - 400 |
300 - 650 |
640 - 900 |
|
TN:TP ratio |
25:1 - 35:1 |
25:1 - 35:1 |
17:1 - 27:1 |
7:1 - 18 - 1 |
|
* Summer averages by ecoregion, based on interquartile range (25th - 75th percentile) for ecoregion reference lakes. Derived in part from Heiskary, S.A. and C.B. Wilson (1990). |
||||